Appearance
Proof of concept project that is a mix of biological health data and identification using the same data
Interfaces
Description
Biometric identity and medical learning system. Secure login based on private local key (biometrics) and remote public key
 Non invasive sensors get unique data from the skin, can be worn as a wearable or fixed.
Purpose
It is designed for biometric identification without using face or fingerprints (These identities that is, fingerprints and face, can be copied and pose some risks and privacy concerns).
It could be used as a cheap diagnotic tool in primary health care.
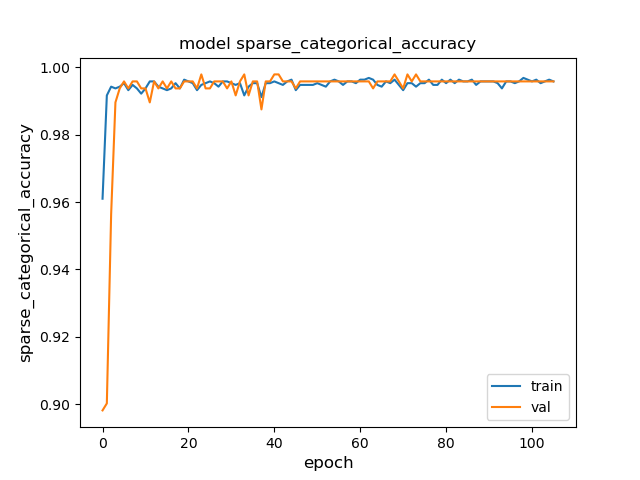
High prediction of left and right hand?
- Using the features electrical and infrared I got an interesting result.
- It was a very small sample so it could be anecdotal, but at 99% it is hard to ignore.
- I added some more data and it stayed in the 99% area
- Only works with both data features, IR and EC using time series classification.
- Individually using IR and EC on their own give low prediction.
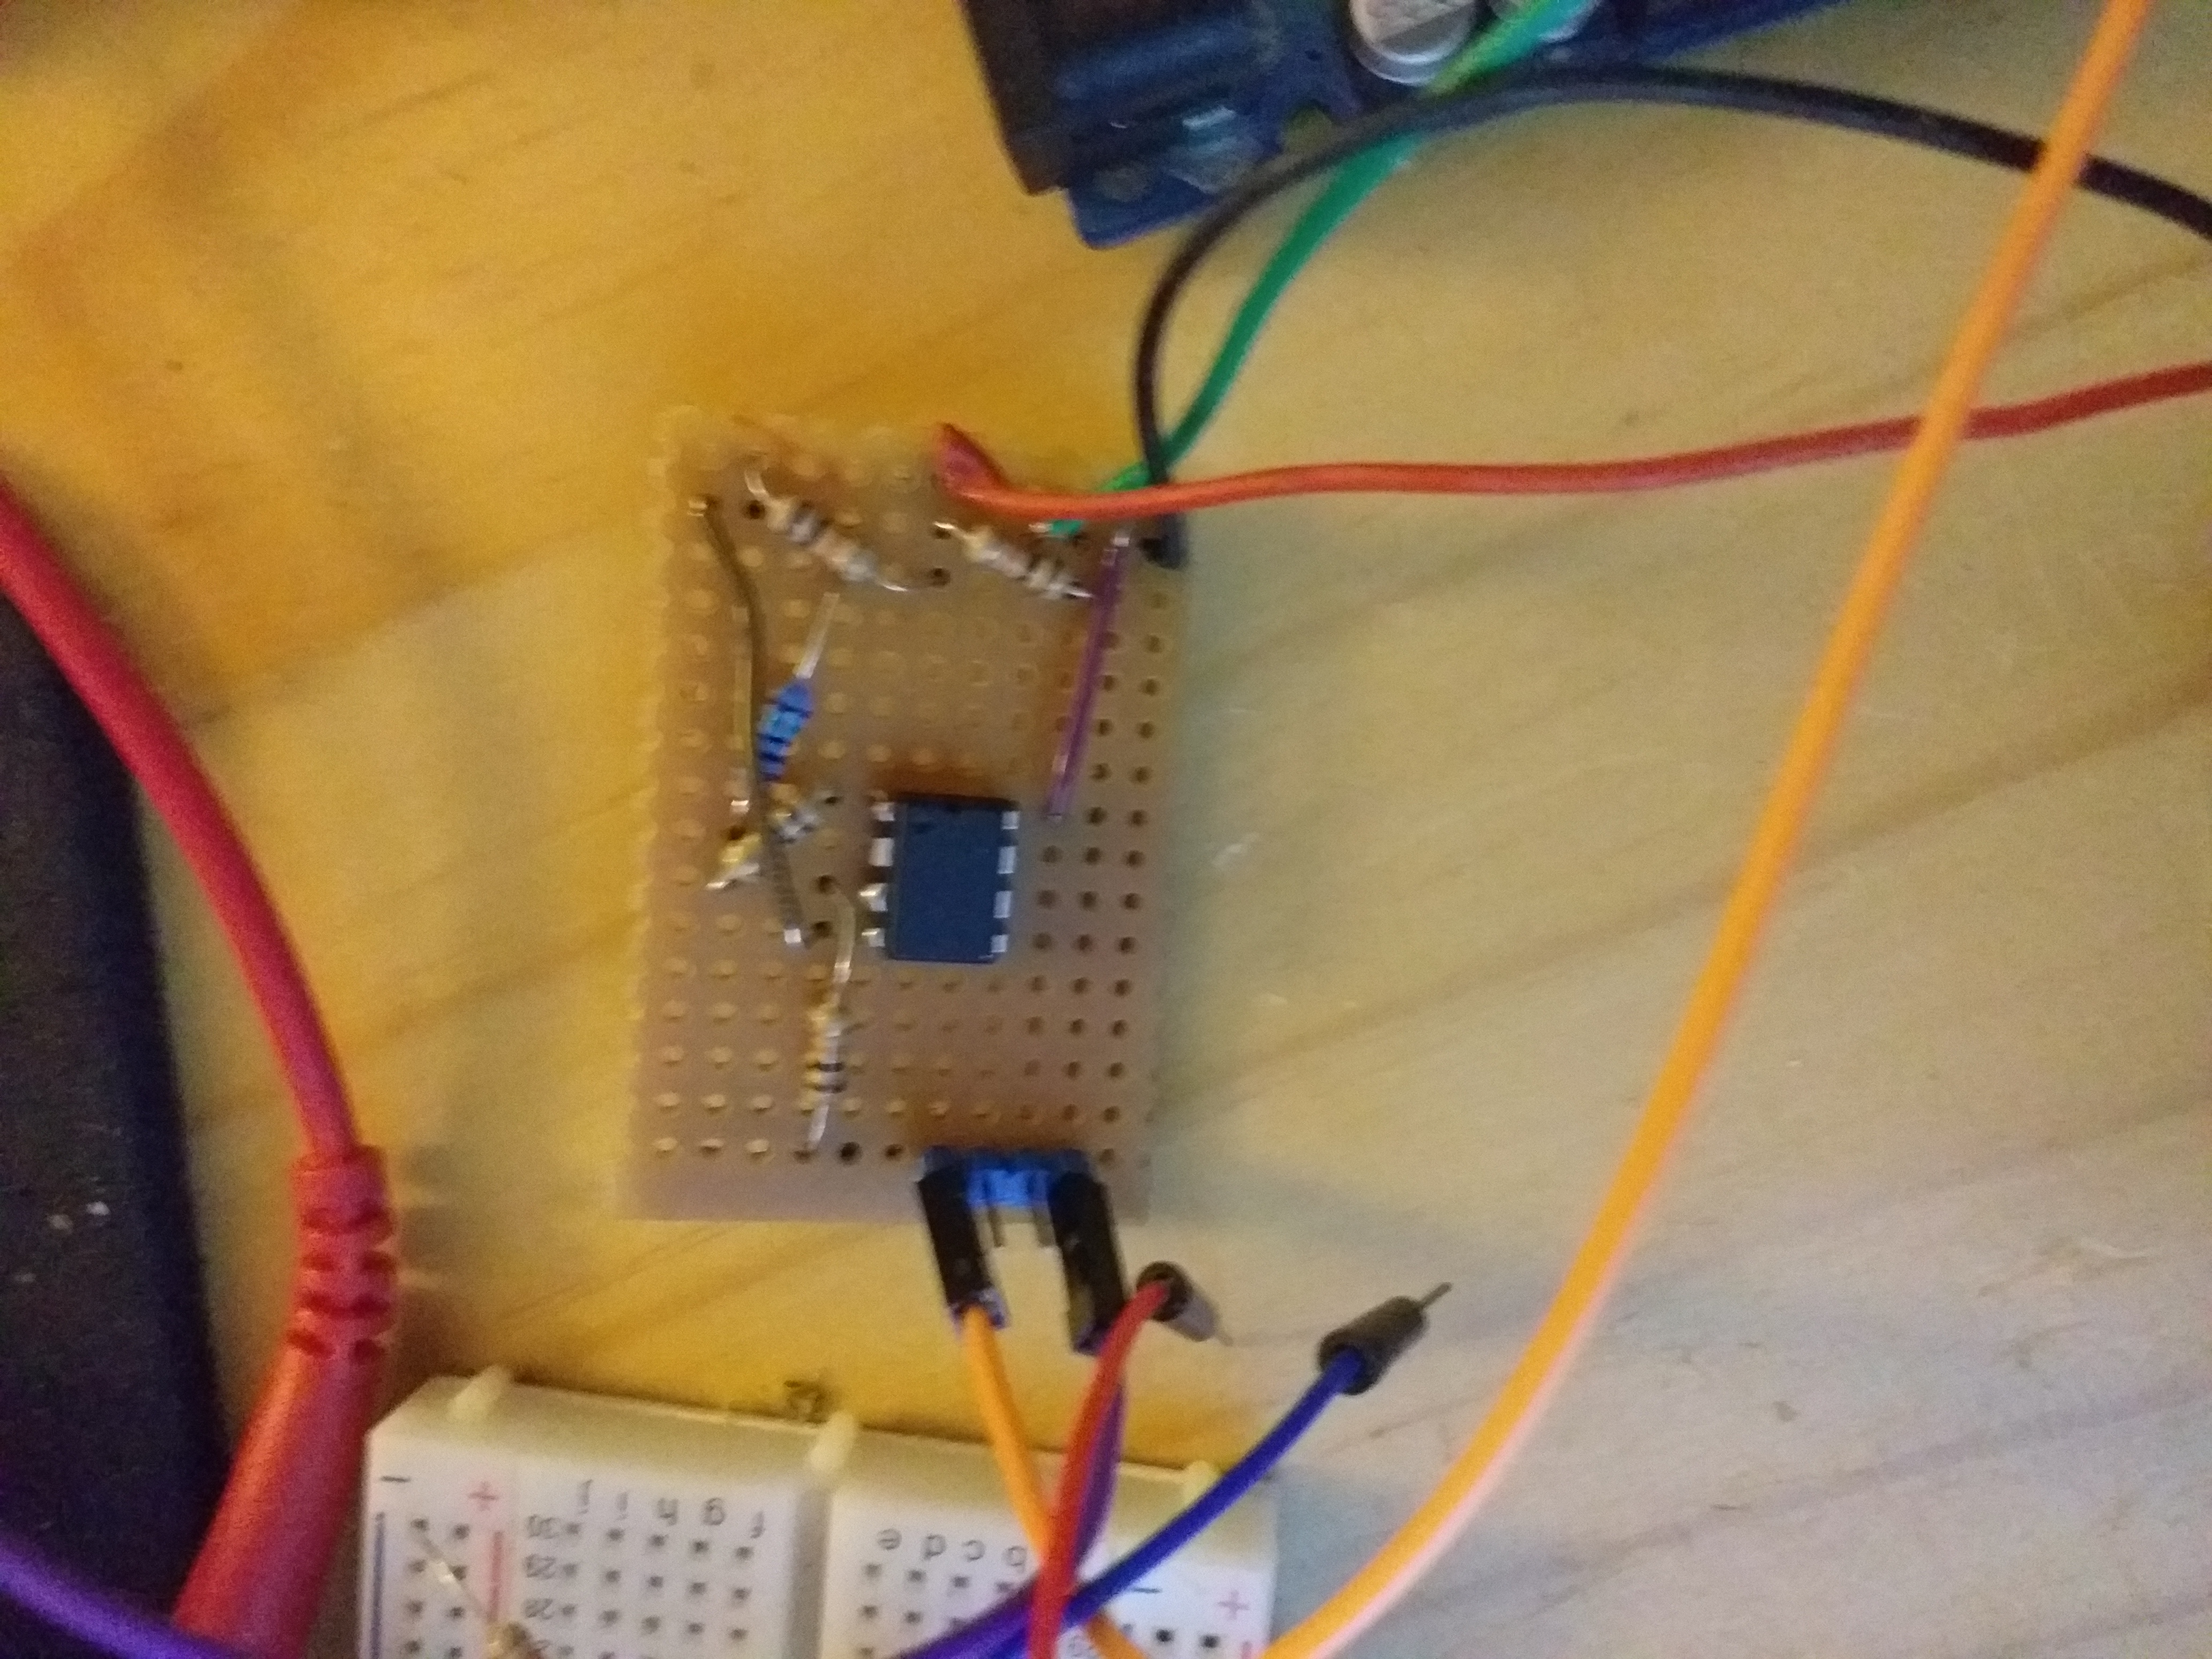
Vero board amplifier gives stable acurate readings.
No noise in the data.
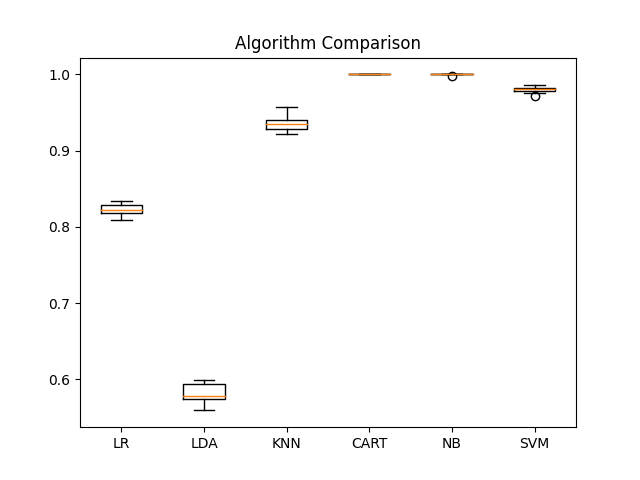
ML algorithm comparison for identity with raw data.
- LR -> LogisticRegression(solver='liblinear', multi_class='ovr')
- LDA -> LinearDiscriminantAnalysis()
- KNN -> KNeighborsClassifier()
- CART -> DecisionTreeClassifier()
- NB -> GaussianNB()
- SVM -> SVC(gamma='auto')
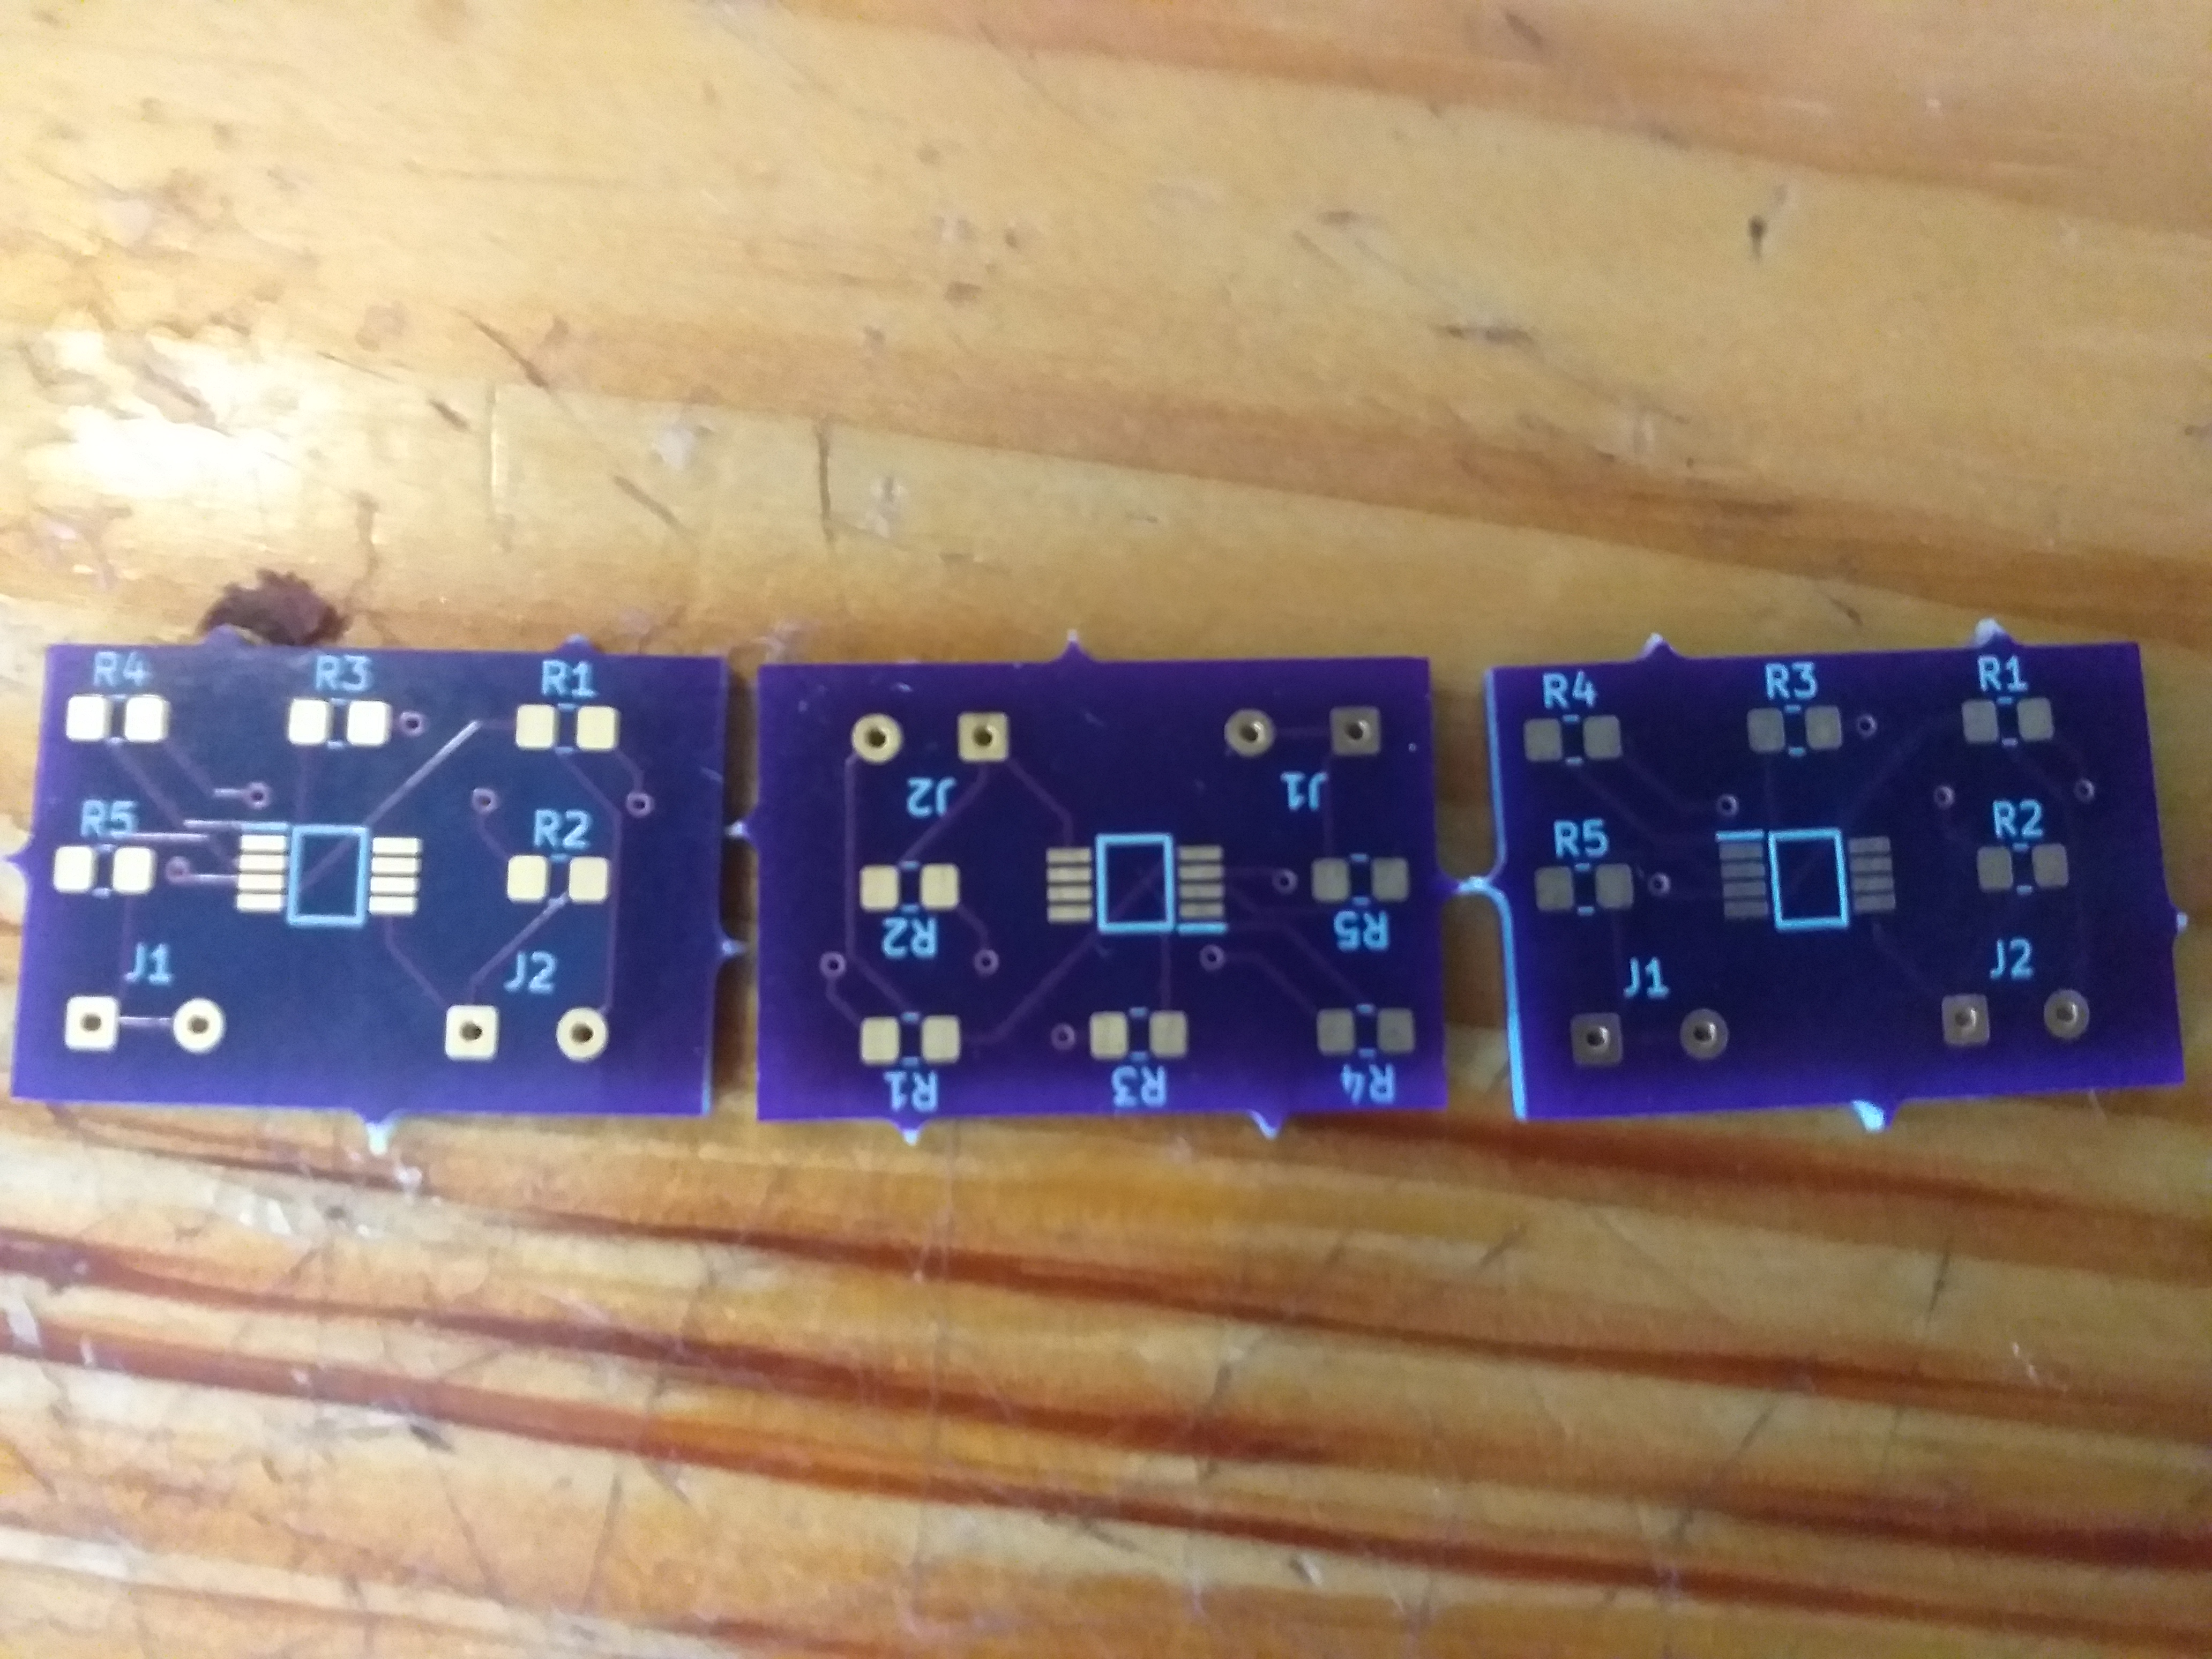
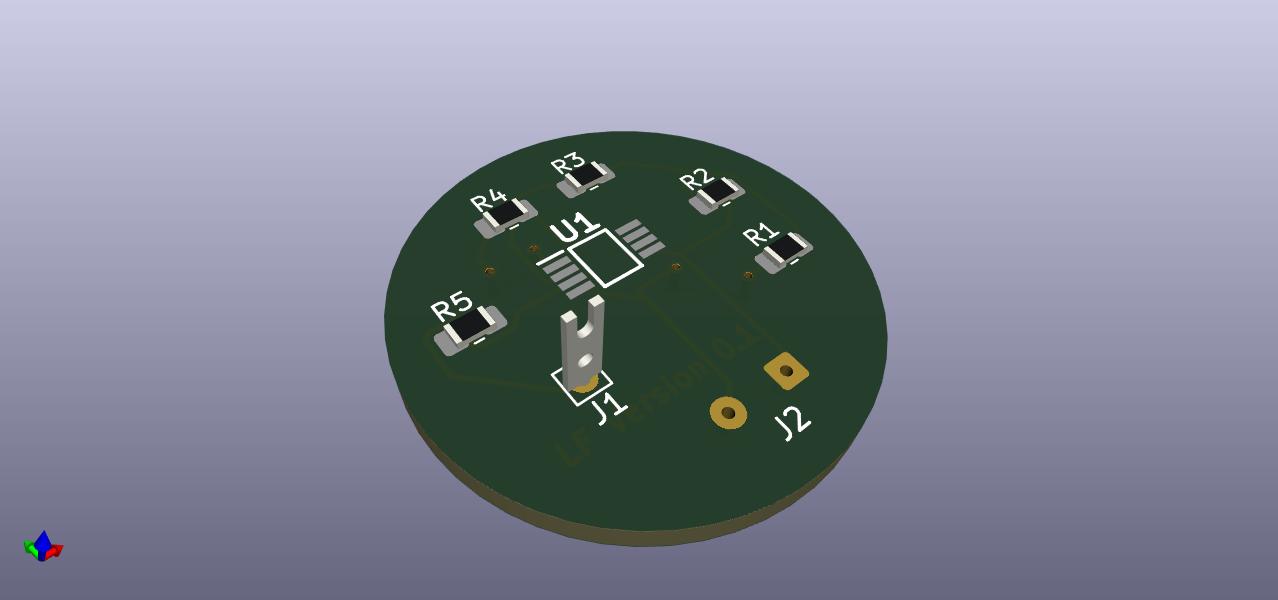
PCB CAD 3D
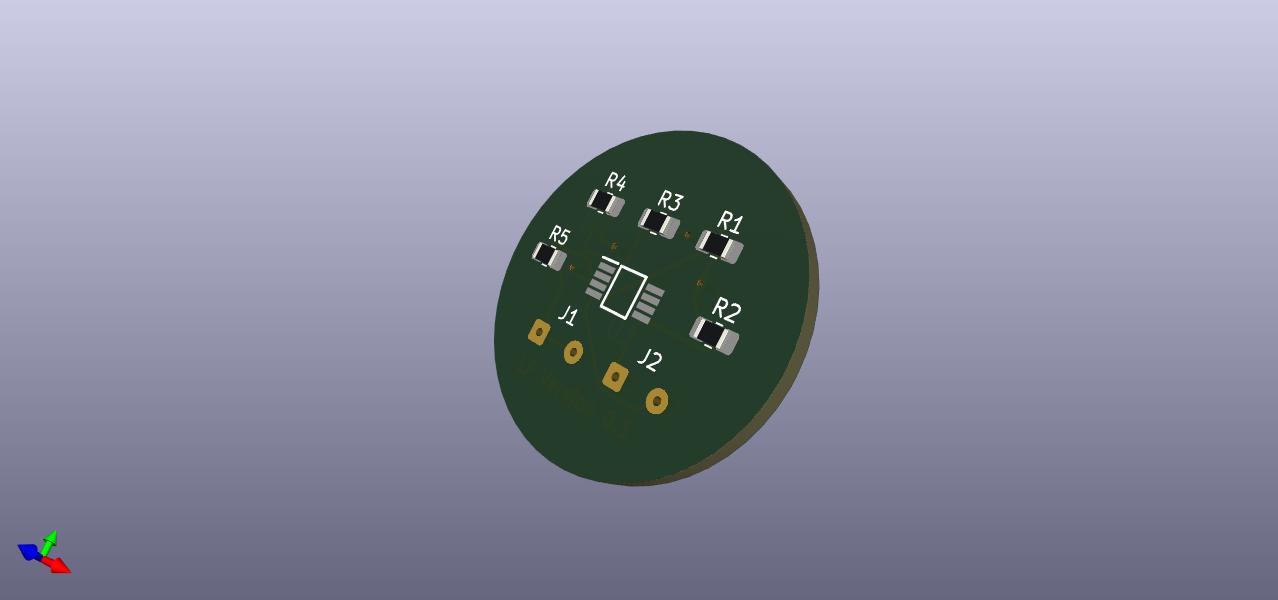
Amplifier modified version (0.2)
Amplifier filter round shape
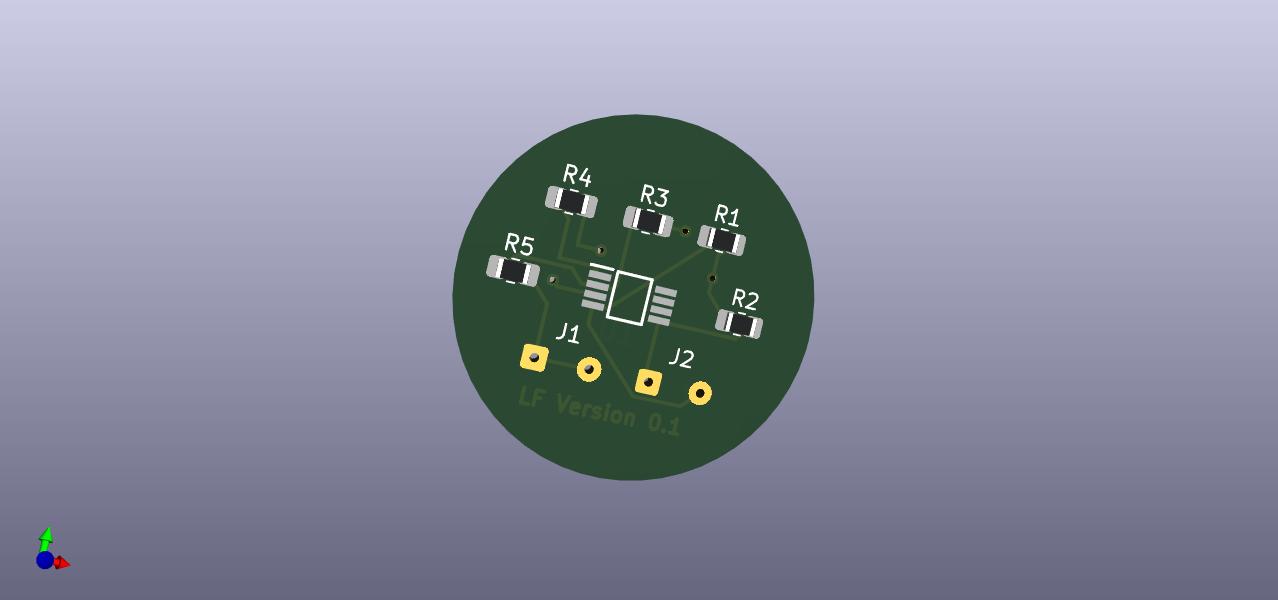
Amplifier filter round shape
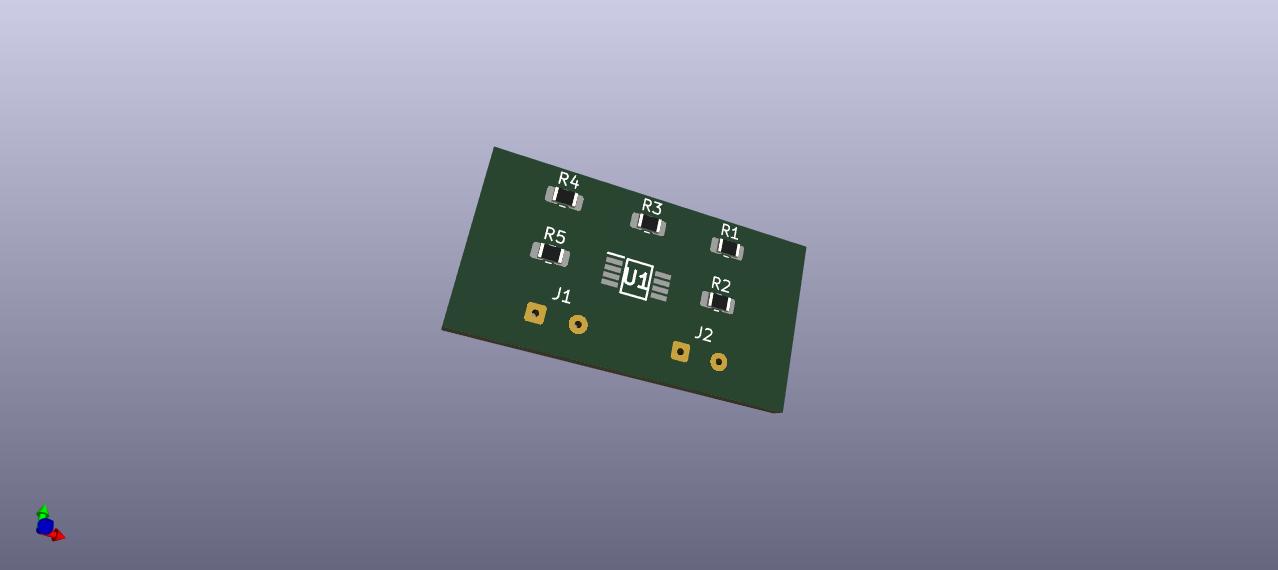
Amplifier filter square shape
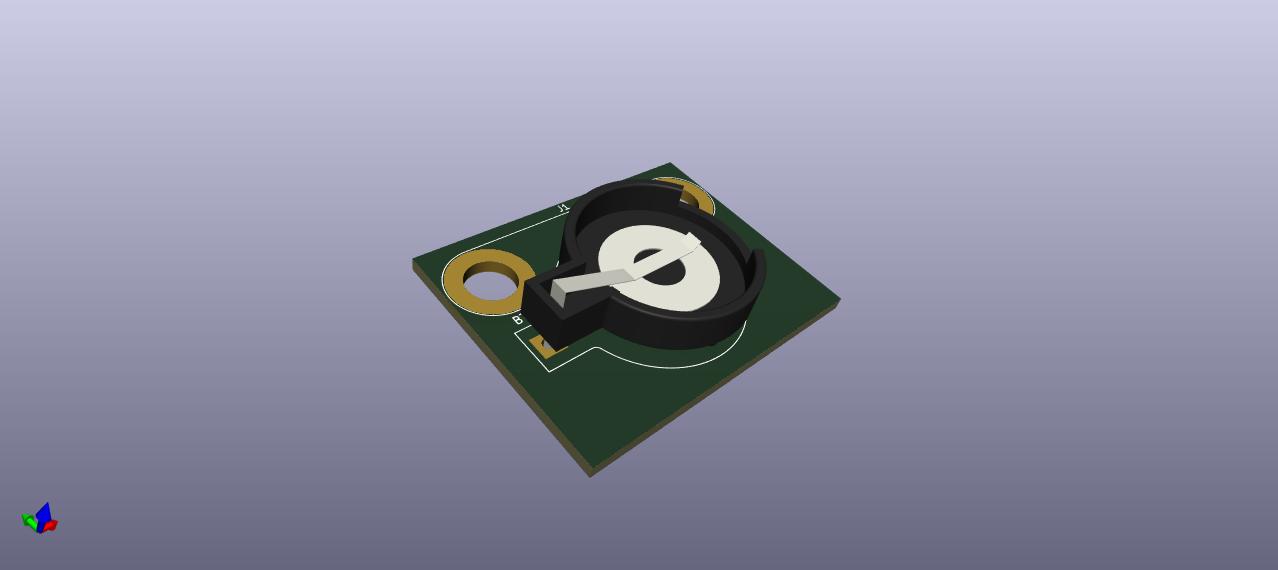
Battery holder
Animated GIFs
Electrical

Infrared
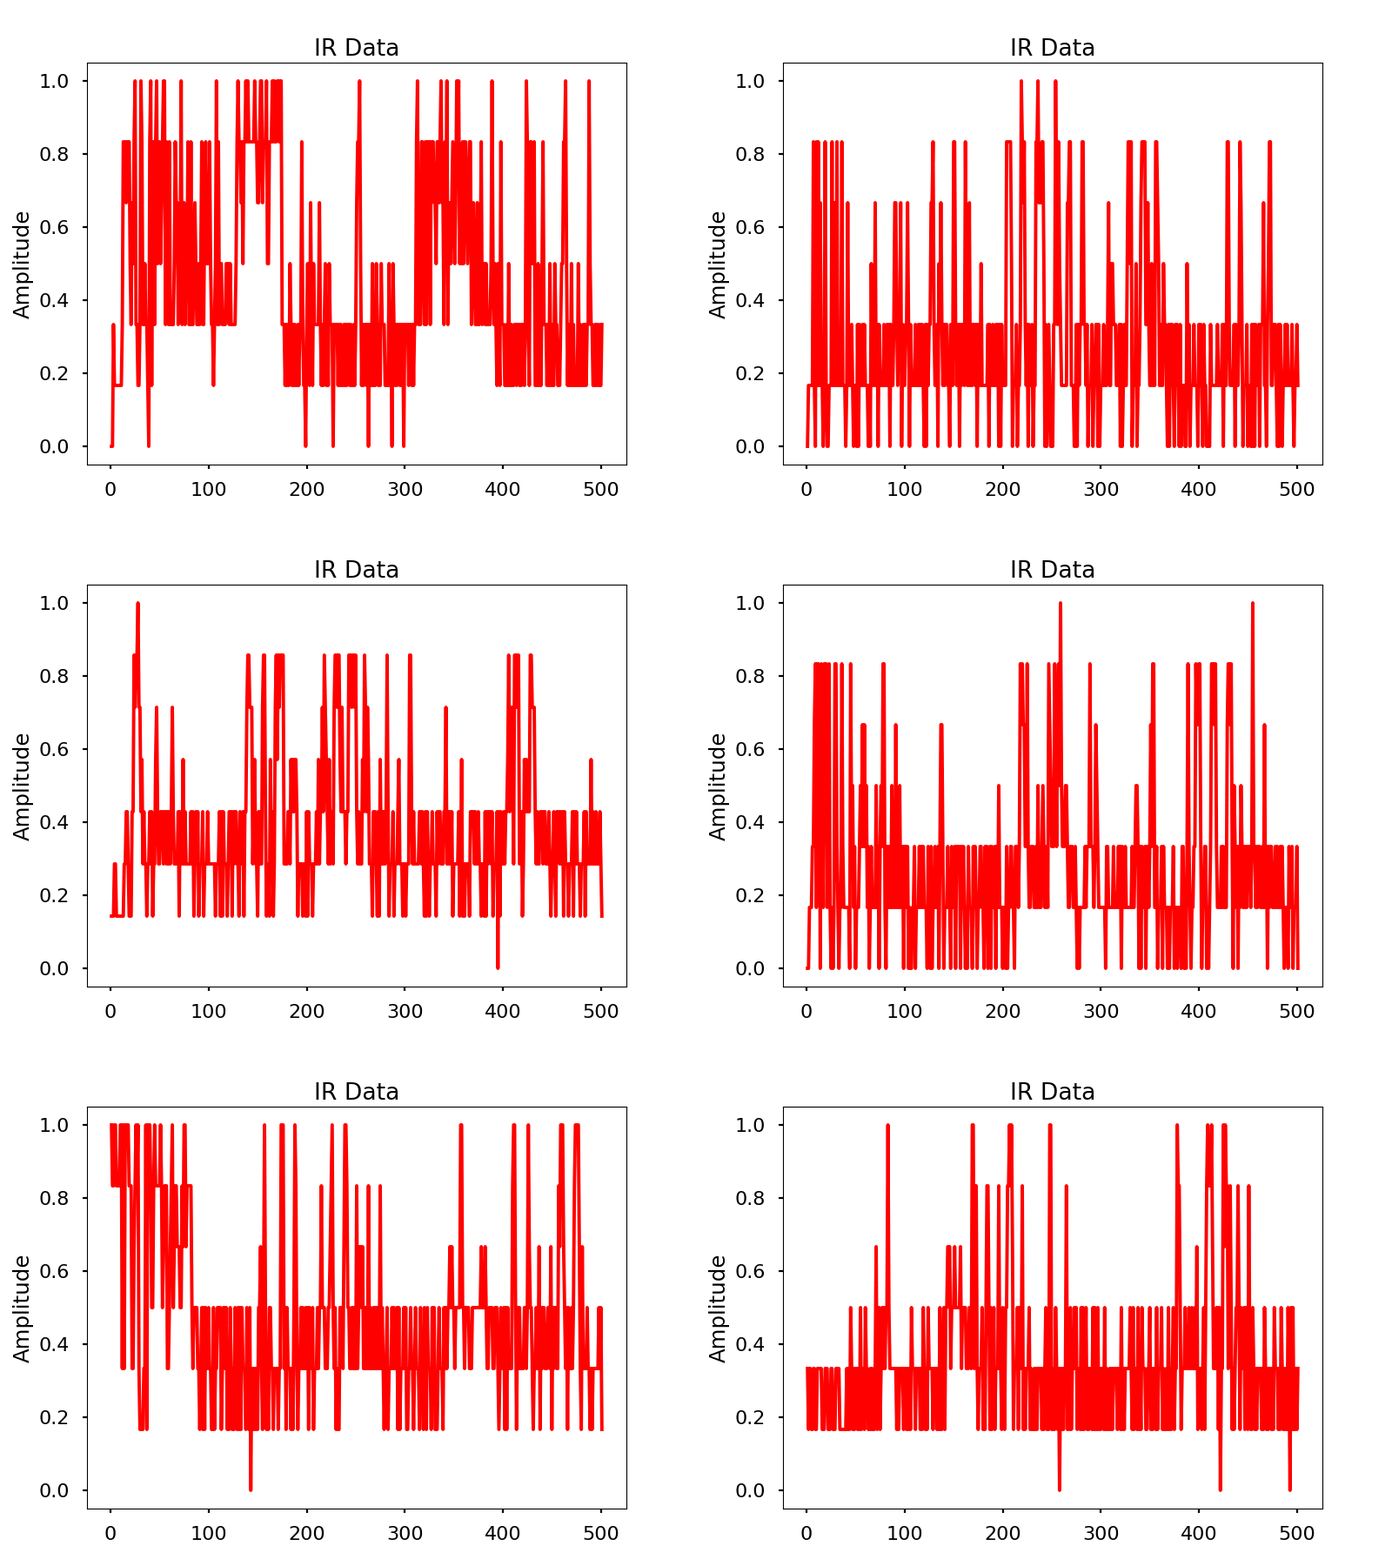
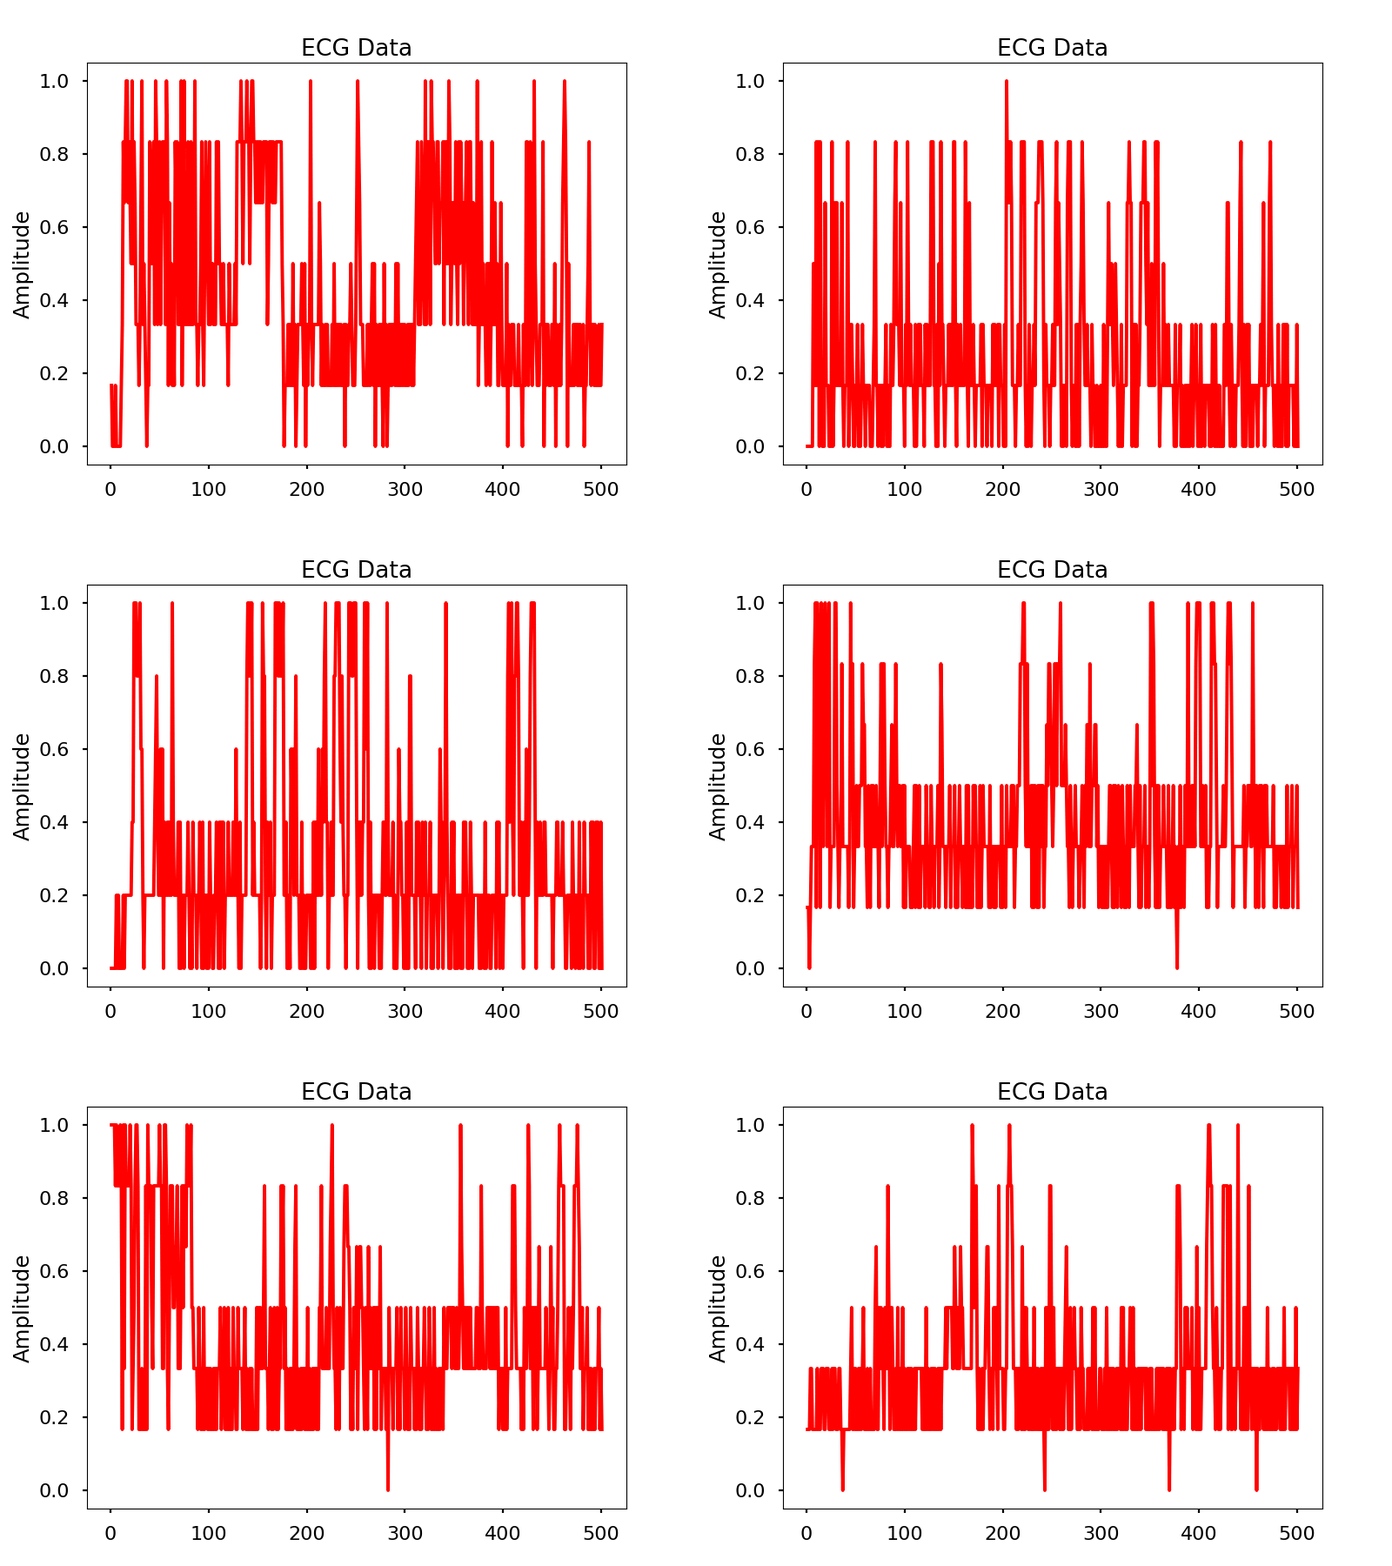
Images
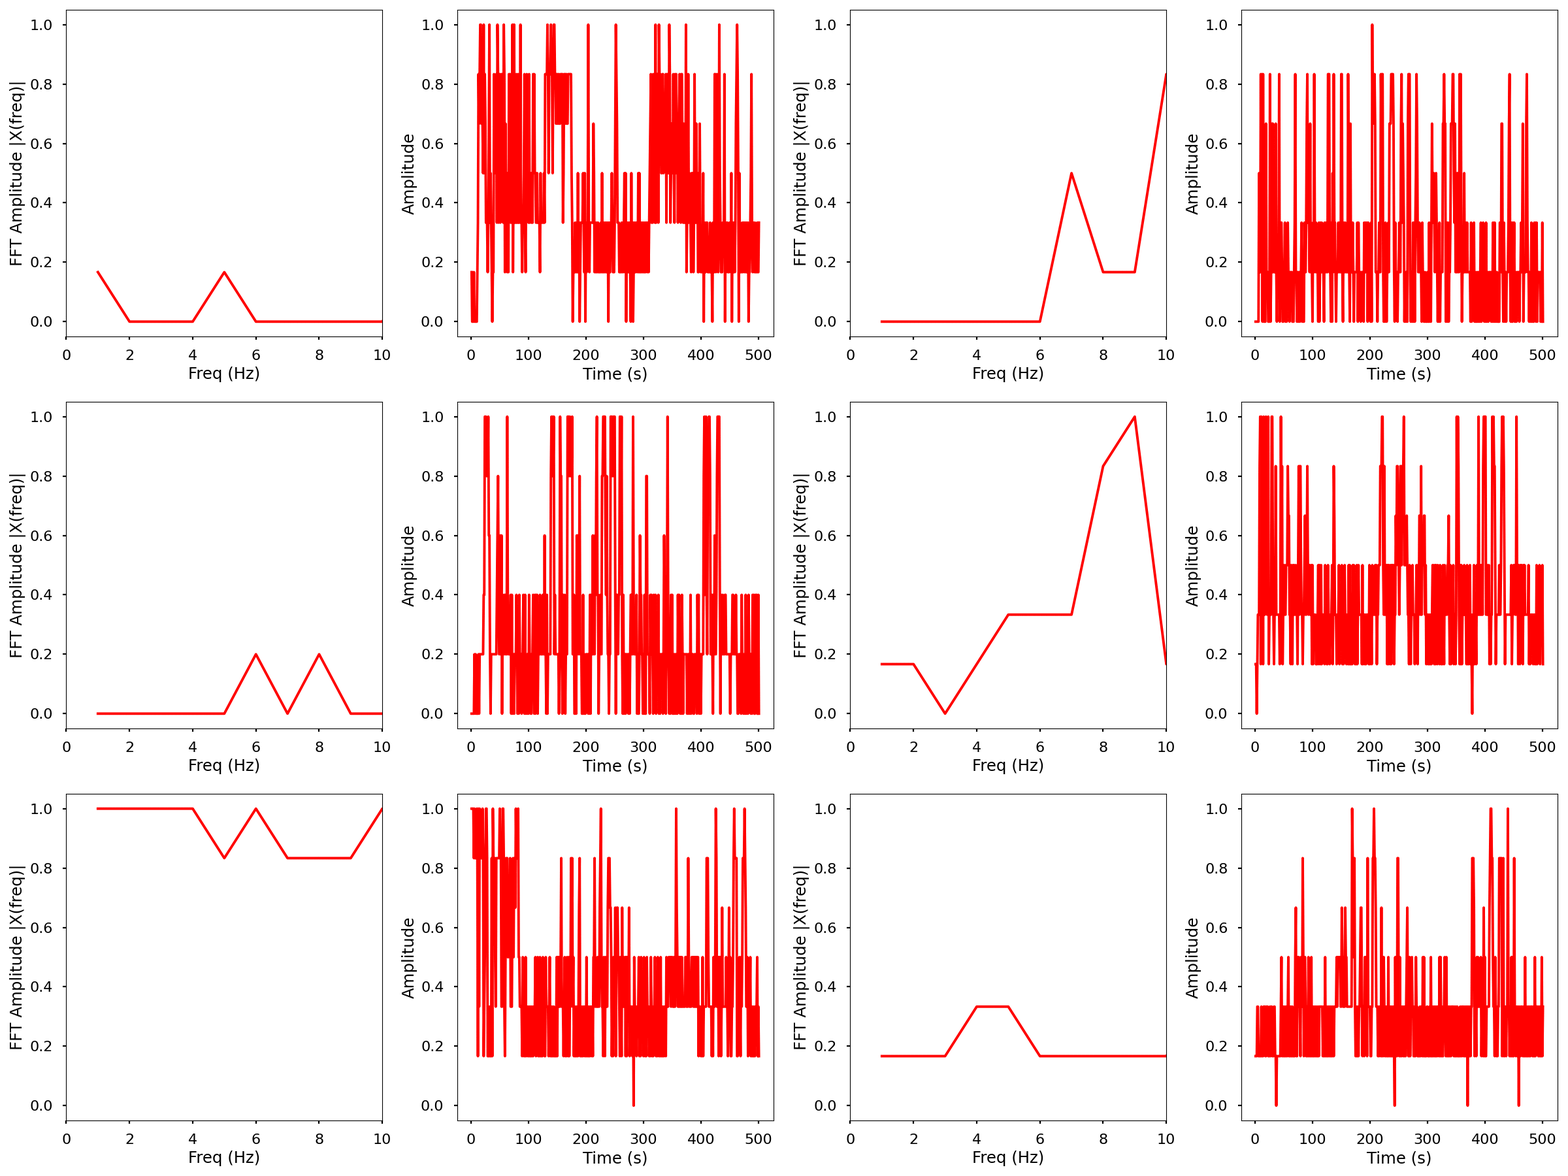
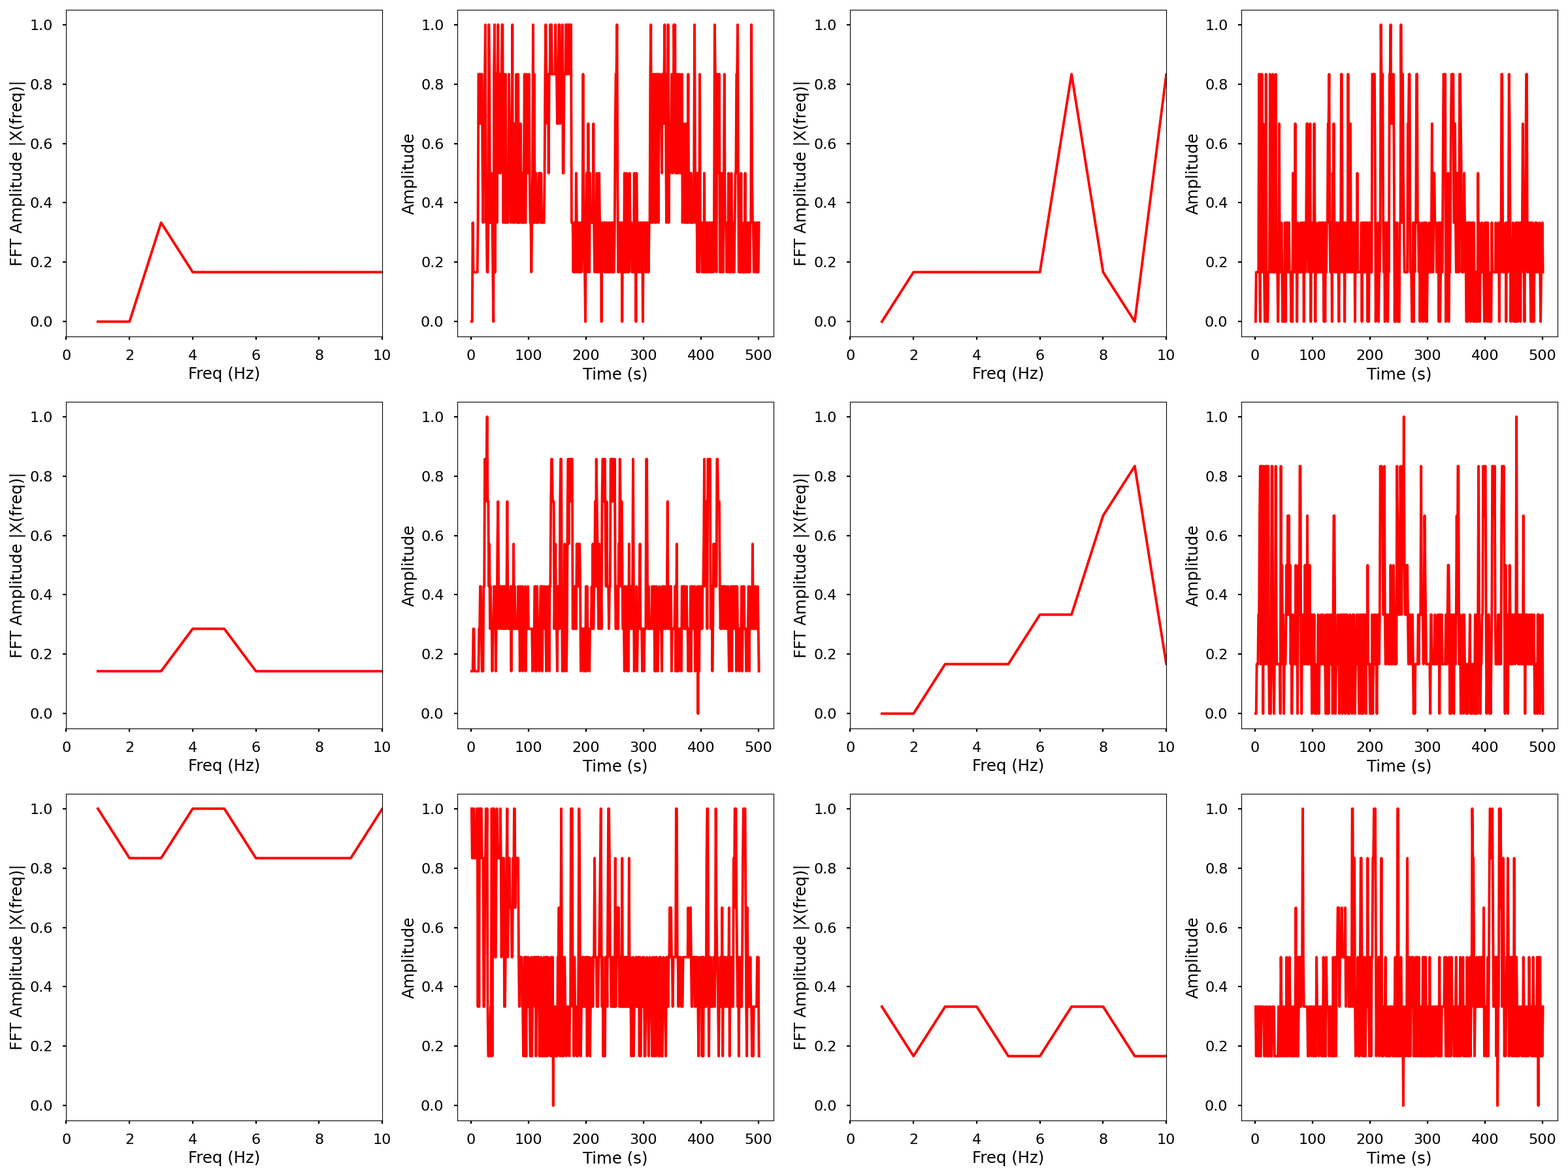
Normalized data by time and frequency.
Electrical activity normalized.
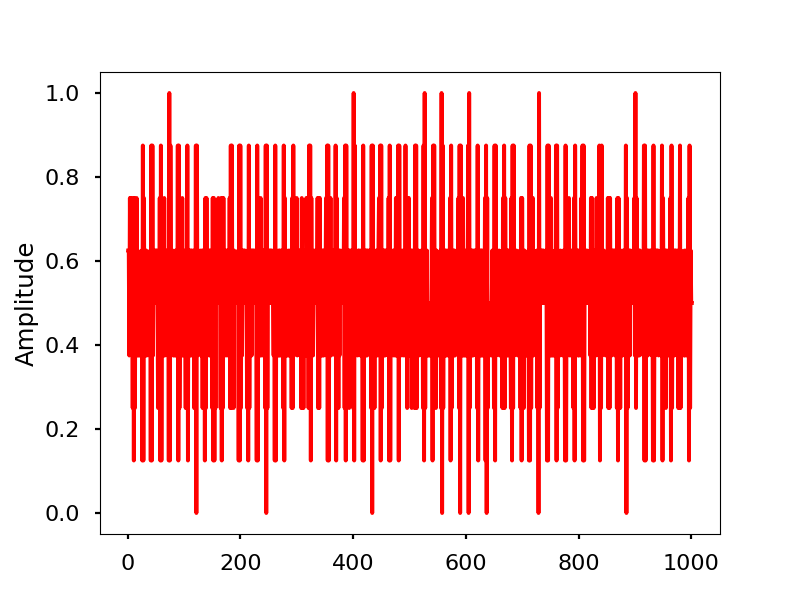
Electrical activity normalized with FFT comparison
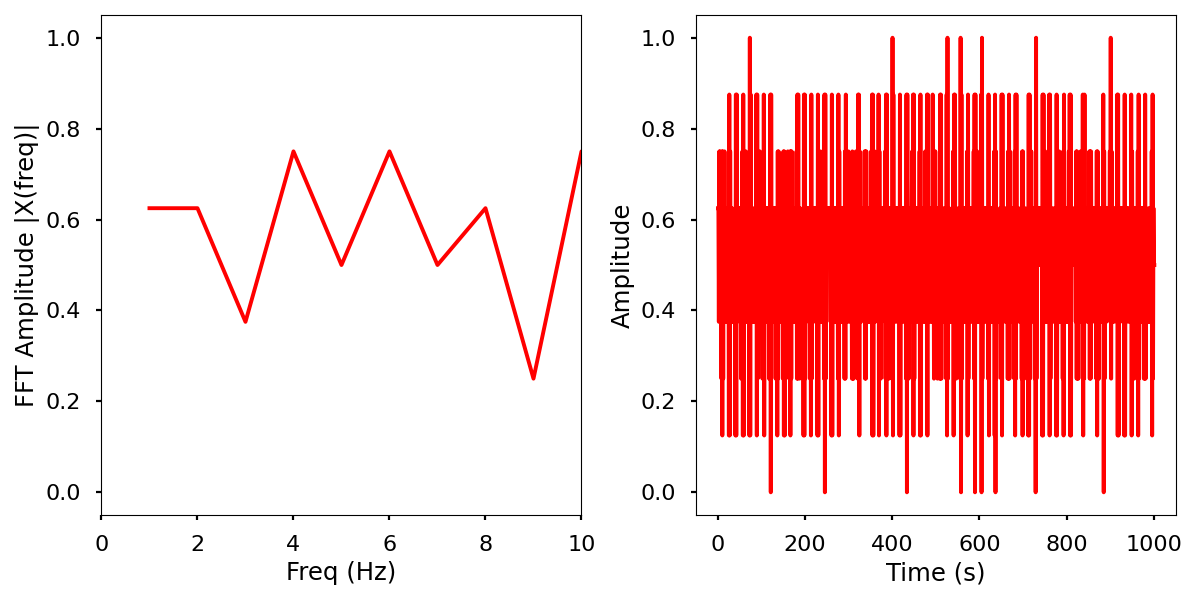
Infrared activity normalized.
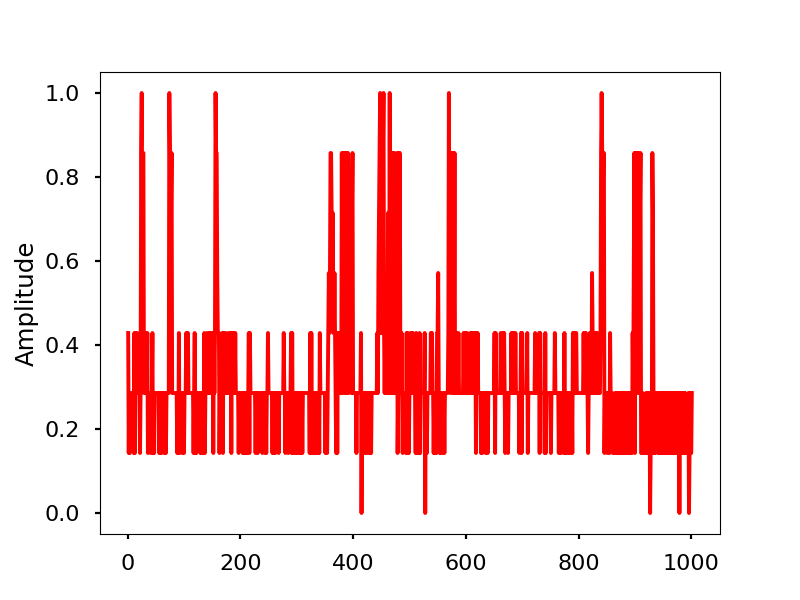
Infrared activity normalized with FFT comparison.
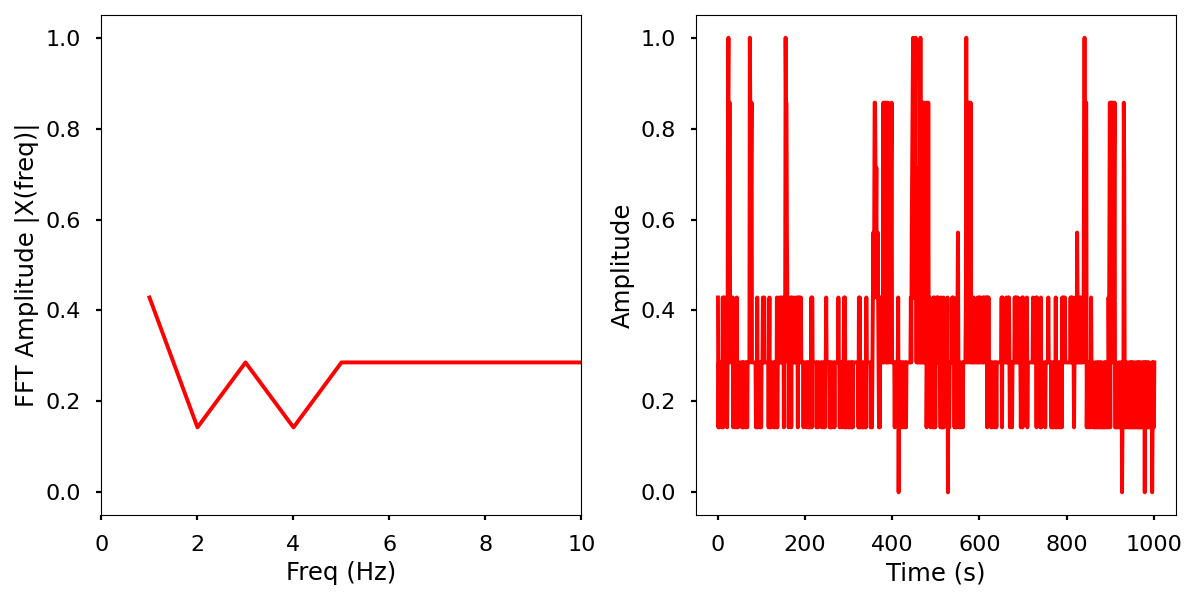
Earlier images.
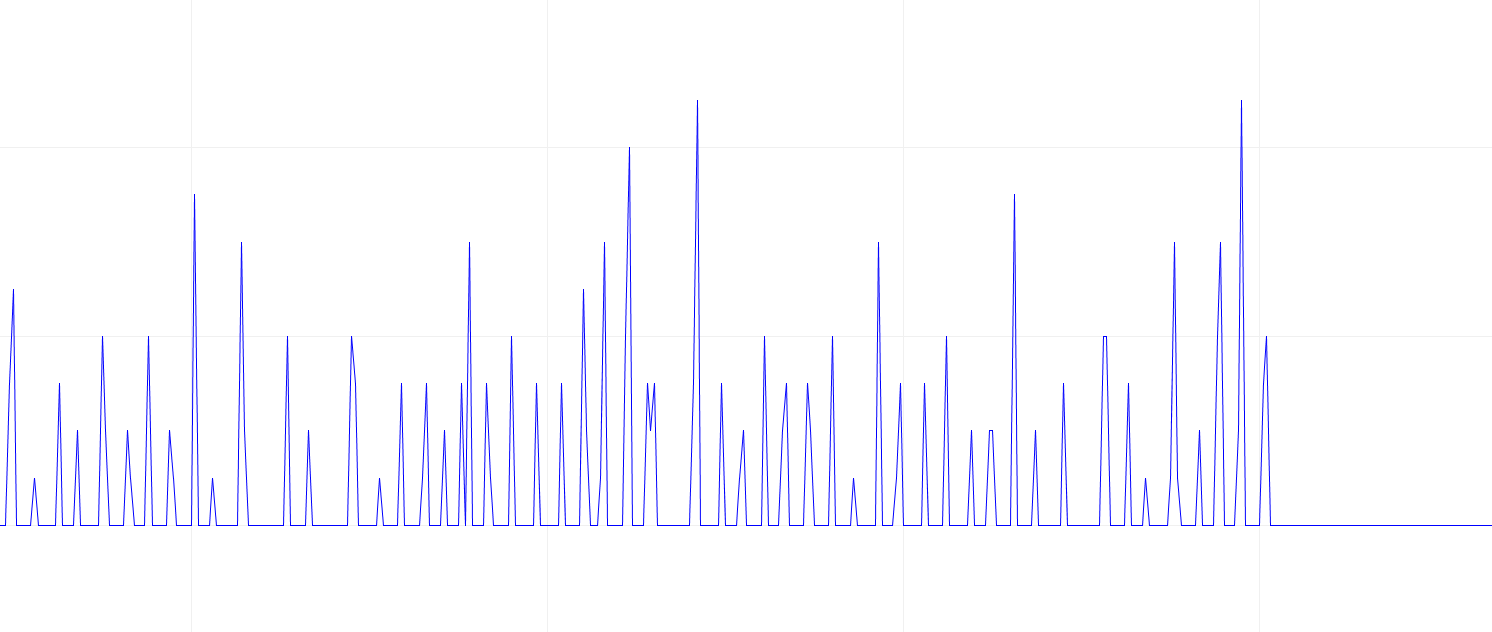
Low pass filter amplifier in the raw for the ECG.
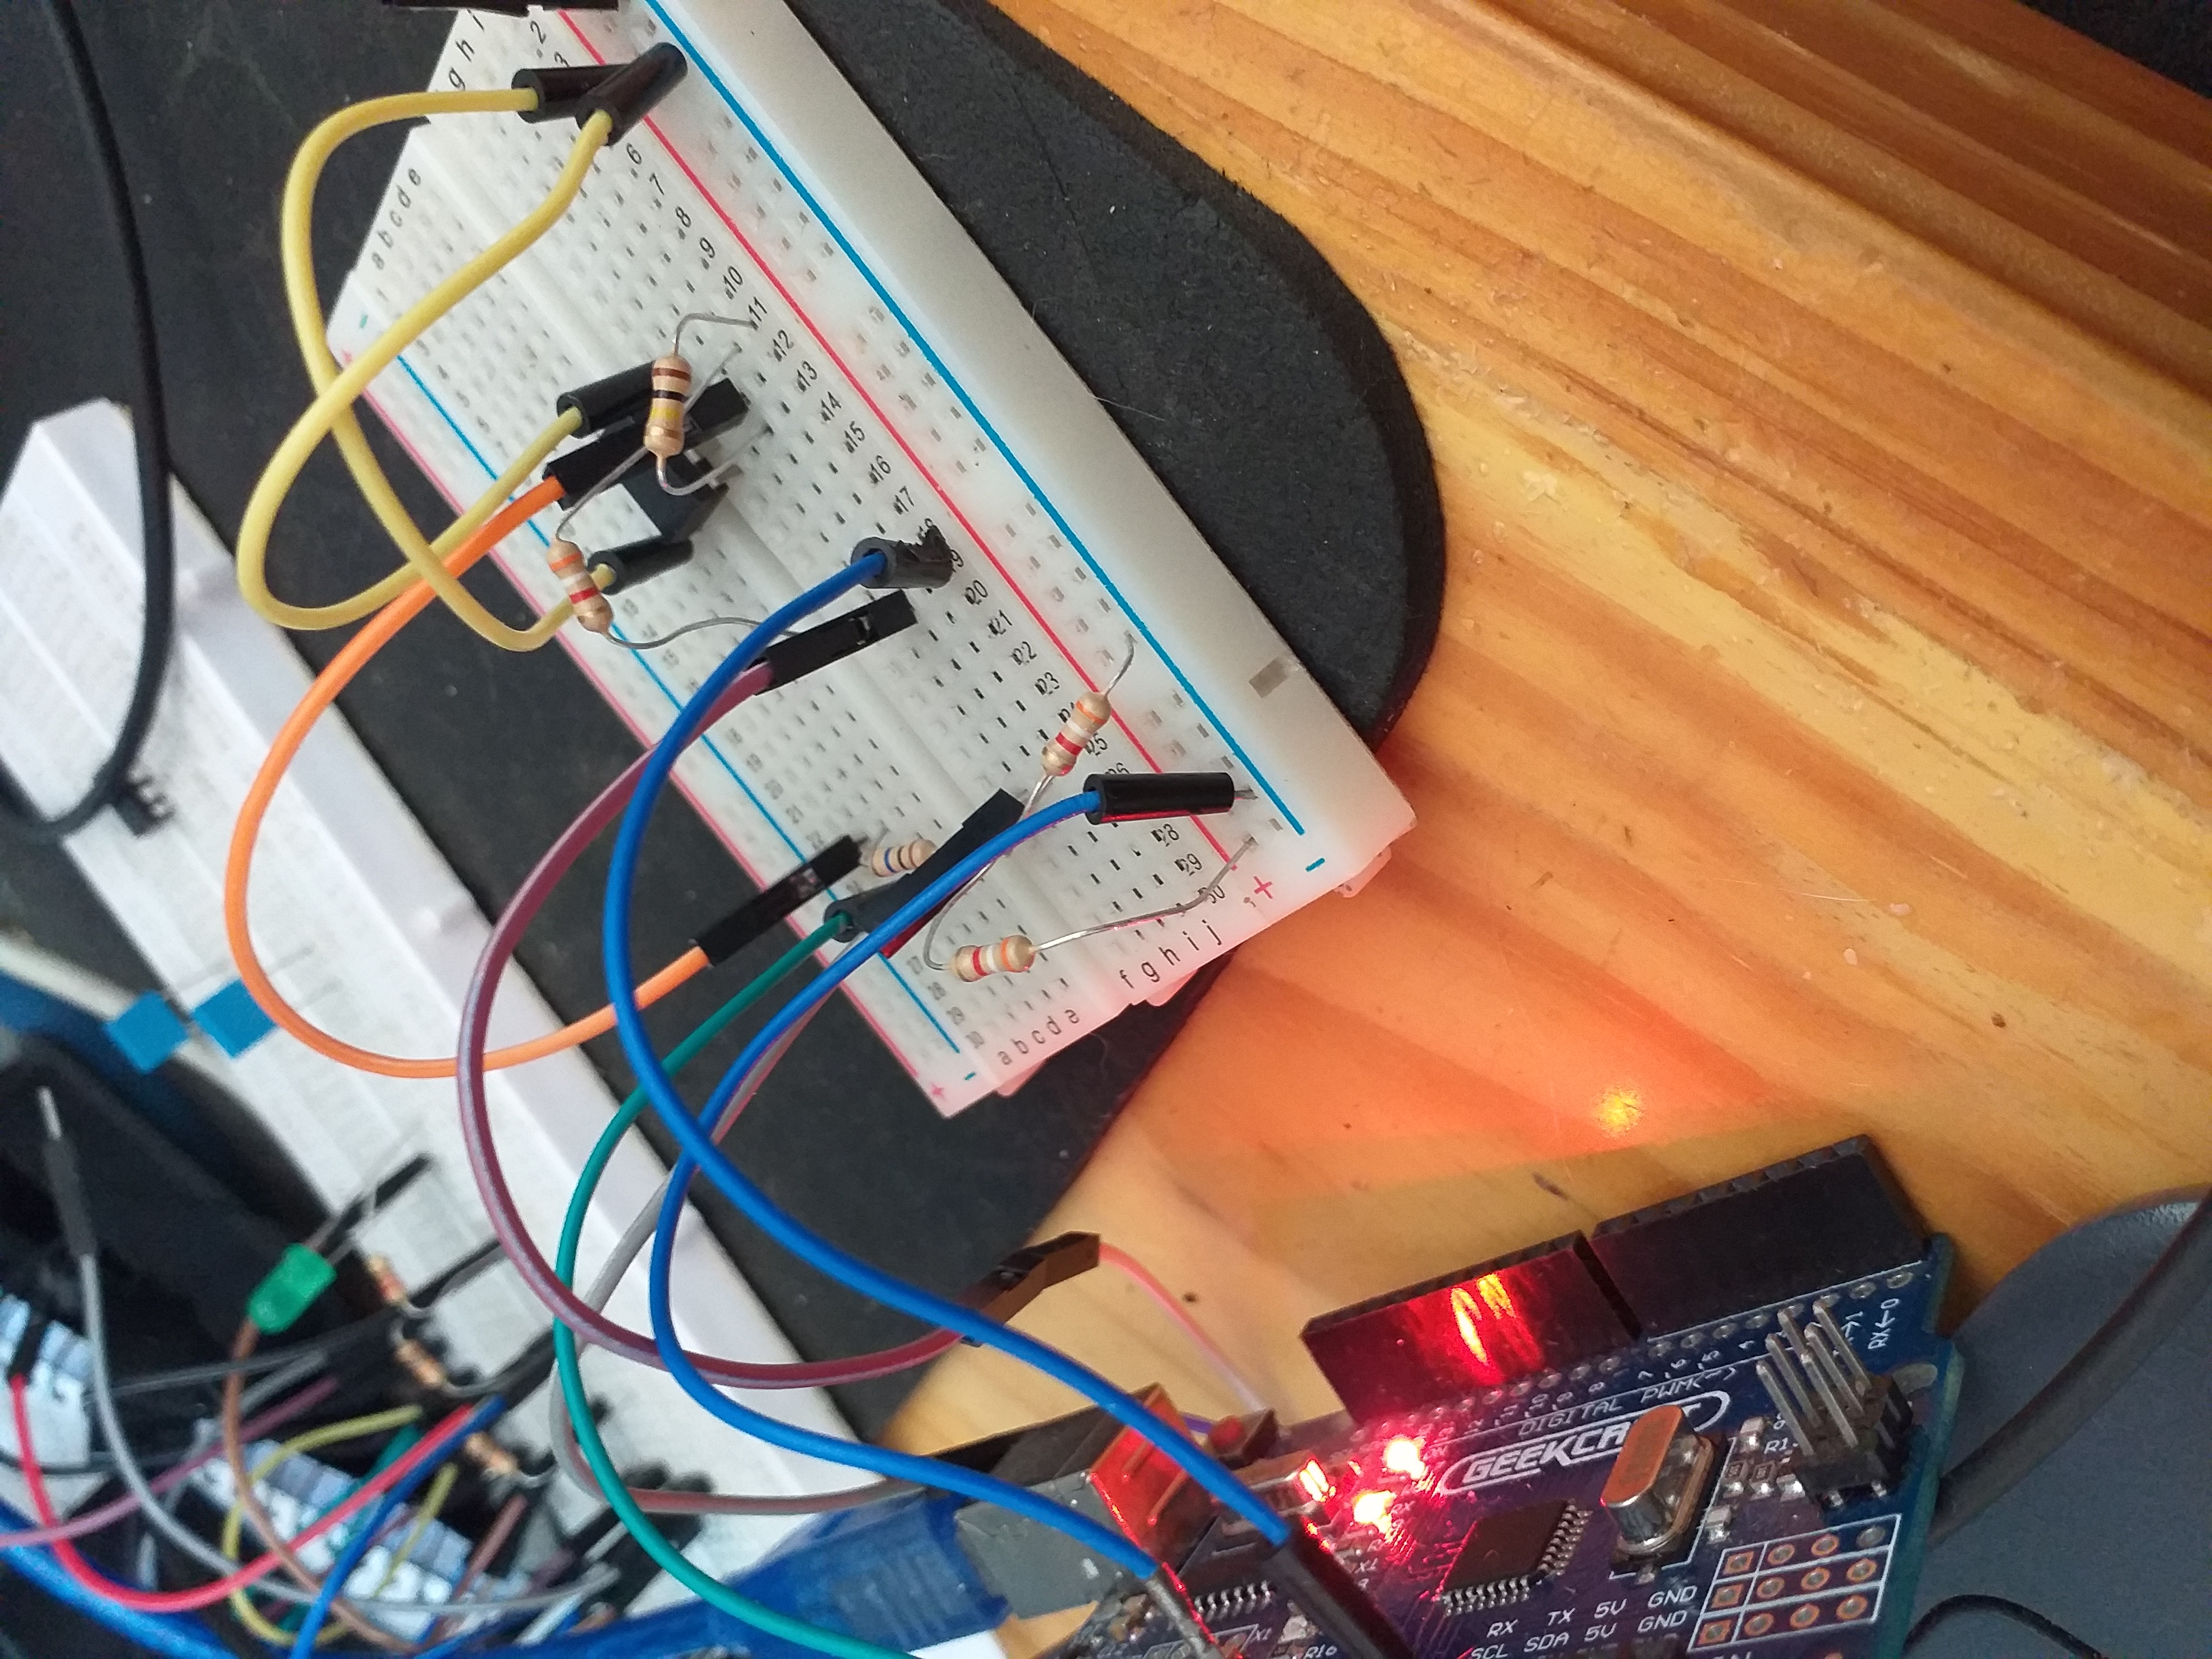
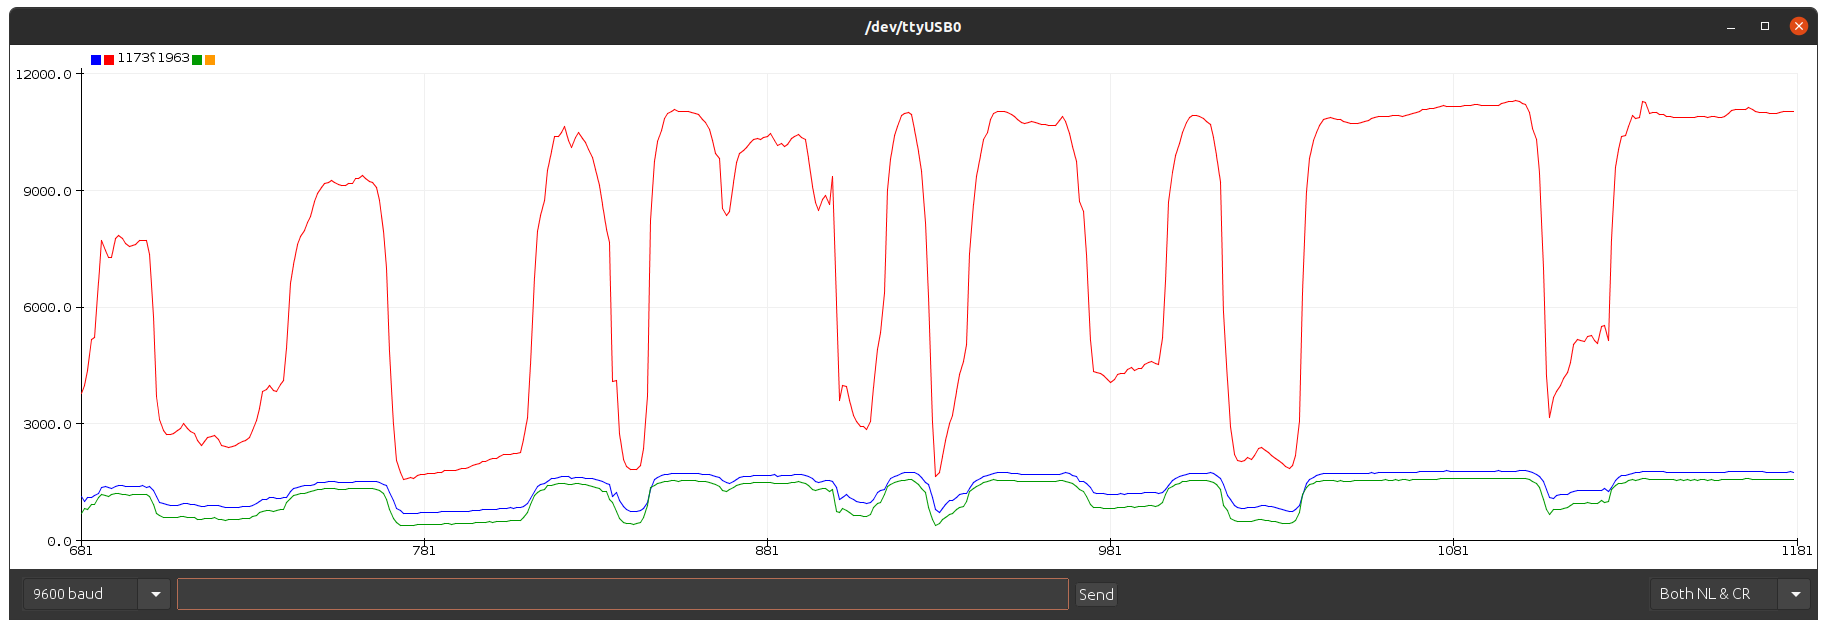
Look for the electrical signal/pulse in the graph.
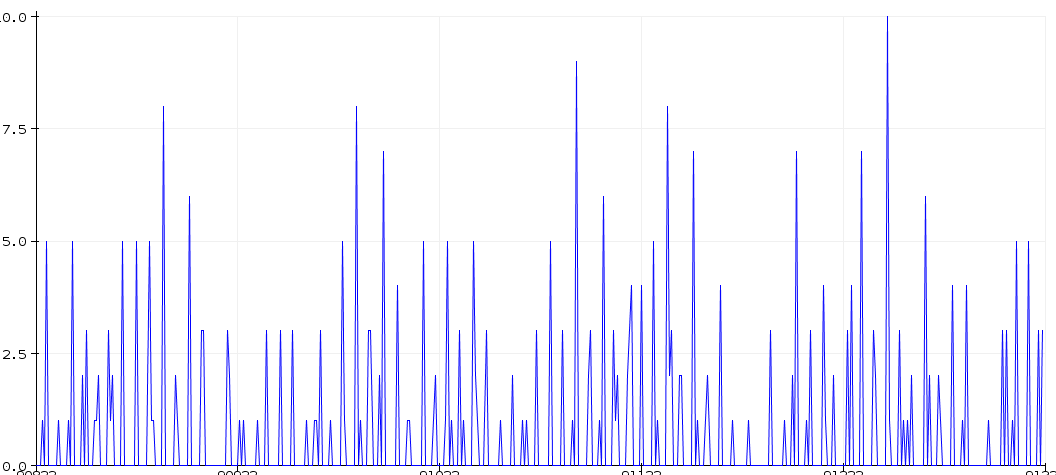
Links
Arduino Heart Rate Monitor Using MAX30102 and Pulse Oximetry
Pulse oximetry: Understanding its basic principles facilitates appreciation of its limitations
Interfacing MAX30102 Pulse Oximeter Heart Rate Module with Arduino
Does Your Medical Image Classifier Know What It Doesn’t Know?
Design and Development of a Low-Cost Arduino-Based Electrical BioImpedance Spectrometer
Pulse and identity method
Hardware used
- KY-039 5V Finger Detection Heartbeat Sensor
- Arduino uno
Arduino code
c
// analogget.c
//Routine reads analog inputs and print out in csv format

double alpha = 0.75;
int period = 20;

int sensorPin0 = A0;
int sensorPin1 = A1;
int sensorPin2 = A2; //if needed

int sensorValue = 0;
int sensorValue2 = 0;
int sensorValue3 = 0; //if needed

void setup() {
  Serial.begin(9600);
}

void loop() {
  sensorValue = analogRead(sensorPin1);
  sensorValue2 = analogRead(sensorPin2);
  Serial.print (sensorValue);
  Serial.print (",");
  Serial.print (sensorValue2);
  Serial.print (",");
  static double oldValue = 0;
  static double oldChange = 0;
  int rawValue = analogRead (sensorPin0);
  double value = alpha * oldValue + (1 - alpha) * rawValue;
  Serial.print (rawValue);
  Serial.print (",");
  Serial.println (value);
  oldValue = value;
  delay (period);
}
Python serial port to csv file.
python
#serialget.py
import serial;

# using datetime module
import datetime;

arduino_port = "/dev/ttyACM0" #serial port of Arduino
baud = 9600 #arduino uno runs at 9600 baud
ser = serial.Serial(arduino_port, baud)
print("Connected to Arduino port:" + arduino_port)

getData=str(ser.readline())
#data=getData
#print(data)

samples = 1500 #how many samples to collect
line = 0
file1 = "DATA/token.csv"
#file2 = "DATA/token2.csv"

open1 = open(file1, "a")
#open1.write("data" + ", " + "output" + "\n")
# I initially timestamped each record may do it later.
while line <= samples:
    ct = datetime.datetime.now()
    #d = str(ct.strftime("%m/%d/%Y %H:%M:%S"))
    getData=ser.readline()
    data=getData.strip().decode()
    print(data)
    open1.write(data + "\n")
    line = line+1
#line = 0
#open2 = open(file2, "a")
#open2.write("timestamp" + ", " + "data" + ", " + "output" + "\n")
#while line <= samples:
#    ct = datetime.datetime.now()
#    d = ct.strftime("%m/%d/%Y, %H:%M:%S")
#    getData=ser.readline()
#    data=getData.strip().decode()
#    print(data)
#    open2.write(str(ct) + ", " + data + ", " + "usb" +  "\n")
#    line = line+1
Test the data
python
#test.py
from pandas import read_csv
from pandas.plotting import scatter_matrix
from matplotlib import pyplot
from sklearn.model_selection import train_test_split
from sklearn.model_selection import cross_val_score
from sklearn.model_selection import StratifiedKFold
from sklearn.metrics import classification_report
from sklearn.metrics import confusion_matrix
from sklearn.metrics import accuracy_score
from sklearn.linear_model import LogisticRegression
from sklearn.tree import DecisionTreeClassifier
from sklearn.neighbors import KNeighborsClassifier
from sklearn.discriminant_analysis import LinearDiscriminantAnalysis
from sklearn.naive_bayes import GaussianNB
from sklearn.svm import SVC

# Load dataset
names = ['moisture','floating', 'raw_pulse', 'pulse', 'class']
# dataset = read_csv(url, names=names)
dataset = read_csv("all.csv", names=names)

#print(dataset.shape)
#print(dataset.head(20))
print("The sensors used in test")
print(dataset.describe())
print("Two test people and ambient/no person")
print(dataset.groupby('class').size())

...
# box and whisker plots
dataset.plot(kind='box', subplots=True, layout=(2,2), sharex=False, sharey=False)
#pyplot.show()
# histograms
dataset.hist()
#pyplot.show()

# scatter plot matrix
scatter_matrix(dataset)
#pyplot.show()

# Split-out validation dataset
array = dataset.values
X = array[:,0:4]
y = array[:,4]
X_train, X_validation, Y_train, Y_validation = train_test_split(X, y, test_size=0.20, random_state=1)

# Spot Check Algorithms
models = []
models.append(('LogisticRegression', LogisticRegression(solver='liblinear', multi_class='ovr')))
models.append(('LinearDiscriminantAnalysis', LinearDiscriminantAnalysis()))
models.append(('KNeighborsClassifier', KNeighborsClassifier()))
models.append(('DecisionTreeClassifier', DecisionTreeClassifier()))
models.append(('GaussianNB', GaussianNB()))
models.append(('SVC', SVC(gamma='auto')))
# evaluate each model in turn
results = []
names = []
for name, model in models:
	kfold = StratifiedKFold(n_splits=20, random_state=1, shuffle=True)
	cv_results = cross_val_score(model, X_train, Y_train, cv=kfold, scoring='accuracy')
	results.append(cv_results)
	names.append(name)
	print('%s: %f (%f)' % (name, cv_results.mean(), cv_results.std()))

# Compare Algorithms
pyplot.boxplot(results, labels=names)
pyplot.title('Algorithm Comparison')
#pyplot.show()

# Make predictions on validation dataset
#model = SVC(gamma='auto')
#model = GaussianNB()
# choose a model for predicting
print("Using DecisionTreeClassifier()")
model = DecisionTreeClassifier()
#model = LogisticRegression(solver='liblinear', multi_class='ovr')

print("Fitting the training data...")
model.fit(X_train, Y_train)
predictions = model.predict(X_validation)

# Evaluate predictions
print(accuracy_score(Y_validation, predictions))
print(confusion_matrix(Y_validation, predictions))
print(classification_report(Y_validation, predictions))

#challenge test using live data stream or saved csv
#['peter' 'peter' 'peter' 'peter' 'peter' 'peter' 'peter' 'peter' 'peter'
# 'peter' 'peter' 'peter' 'peter' 'peter' 'peter' 'peter' 'peter' 'peter'
# 'peter' 'peter' 'peter' 'alex' 'alex' 'alex' 'alex' 'alex' 'alex' 'alex'
# 'alex']

print("External data challenge...")
challenge = read_csv("challenge.csv")
prediction = model.predict(challenge)
print(prediction)

#print(model.predict_proba(challenge))
Training data sample
csv
------
102,551,899,393.31,"peter"
102,552,900,519.98,"peter"
102,552,901,615.24,"peter"
103,553,902,686.93,"peter"
103,556,902,740.7,"peter"
104,559,903,781.27,"peter"
103,561,903,811.7,"peter"
104,563,904,834.78,"peter"
104,565,904,852.08,"peter"
103,567,904,865.06,"peter"
104,568,906,875.3,"peter"
103,570,906,882.97,"peter"
102,571,908,889.23,"peter"
102,568,909,894.17,"peter"
100,566,908,897.63,"peter"
100,564,908,900.22,"peter"
101,562,908,902.17,"peter"
101,564,908,903.62,"peter"
101,561,908,904.72,"peter"
101,563,908,905.54,"peter"
----
Output of test example
The sensors used in test
          moisture     floating    raw_pulse        pulse
count  4504.000000  4504.000000  4504.000000  4504.000000
mean    112.906750   427.482016   828.615453   827.239145
std      83.329644   237.495365    68.051782    70.792391
min       0.000000     0.000000   744.000000   198.000000
25%       0.000000   171.000000   750.000000   749.790000
50%     147.000000   590.000000   822.000000   822.030000
75%     191.000000   595.000000   914.000000   914.110000
max     205.000000   605.000000   920.000000   919.740000
Two test people and ambient/no person
class
alex       1501
ambient    1502
peter      1501
dtype: int64
LogisticRegression: 1.000000 (0.000000)
LinearDiscriminantAnalysis: 1.000000 (0.000000)
KNeighborsClassifier: 0.998889 (0.002833)
DecisionTreeClassifier: 1.000000 (0.000000)
GaussianNB: 0.999167 (0.002650)
SVC: 0.990838 (0.007087)
Using DecisionTreeClassifier()
Fitting the training data...
1.0
[[319   0   0]
 [  0 293   0]
 [  0   0 289]]
              precision    recall  f1-score   support

        alex       1.00      1.00      1.00       319
     ambient       1.00      1.00      1.00       293
       peter       1.00      1.00      1.00       289

    accuracy                           1.00       901
   macro avg       1.00      1.00      1.00       901
weighted avg       1.00      1.00      1.00       901

External data challenge...
['peter' 'peter' 'peter' 'peter' 'peter' 'peter' 'peter' 'peter' 'peter'
 'peter' 'peter' 'peter' 'peter' 'peter' 'peter' 'peter' 'peter' 'peter'
 'peter' 'peter' 'peter' 'alex' 'alex' 'alex' 'alex' 'alex' 'alex' 'alex'
 'alex' 'ambient' 'ambient' 'ambient' 'ambient' 'ambient' 'ambient'
'ambient' 'ambient' 'ambient' 'ambient' 'ambient' 'ambient' 'ambient'] nix64bit